
KPI cards
The small cards in the top row of the dashboard, each with one headline number.
Updated 2 min read
Where: Journal → Dashboard → top row
Read the KPI row
- Open Dashboard.
- Look at the top row. It holds 3 to 5 cards.
- Each card counts the trades in your date range, accounts and filters.
- Change the period in the top bar and every card recalculates.
Add other KPI cards
- Open the templates menu and click the pencil of your template.
- Click the Add KPI button (+) in the top row. It shows while the row has fewer than 5 cards.
- Pick a card and click Done.
Besides the five on the screenshot, you can add:
- Account Balance: your current balance (starting balance, all P&L, deposits, withdrawals and payouts) and the period's P&L.
- Day Win %: the share of your green days out of your green and red days. Break-even days don't count. The line under it shows how many of each.
- Max Drawdown: the deepest fall from a peak of your day-by-day running P&L, in money. The line under it shows the same fall in %. See max drawdown.
- Avg Drawdown: the average fall while you were below a peak.
- Current Day Streak: green (or red) days in a row up to today. See streak.
- Current Trade Streak: winning (or losing) trades in a row up to the last one.
- Current Streak: both streaks in one card.
- Consistency Compliance: share of your Consistency Hub rules met in the last 30 days. See compliance.
What's on the screen
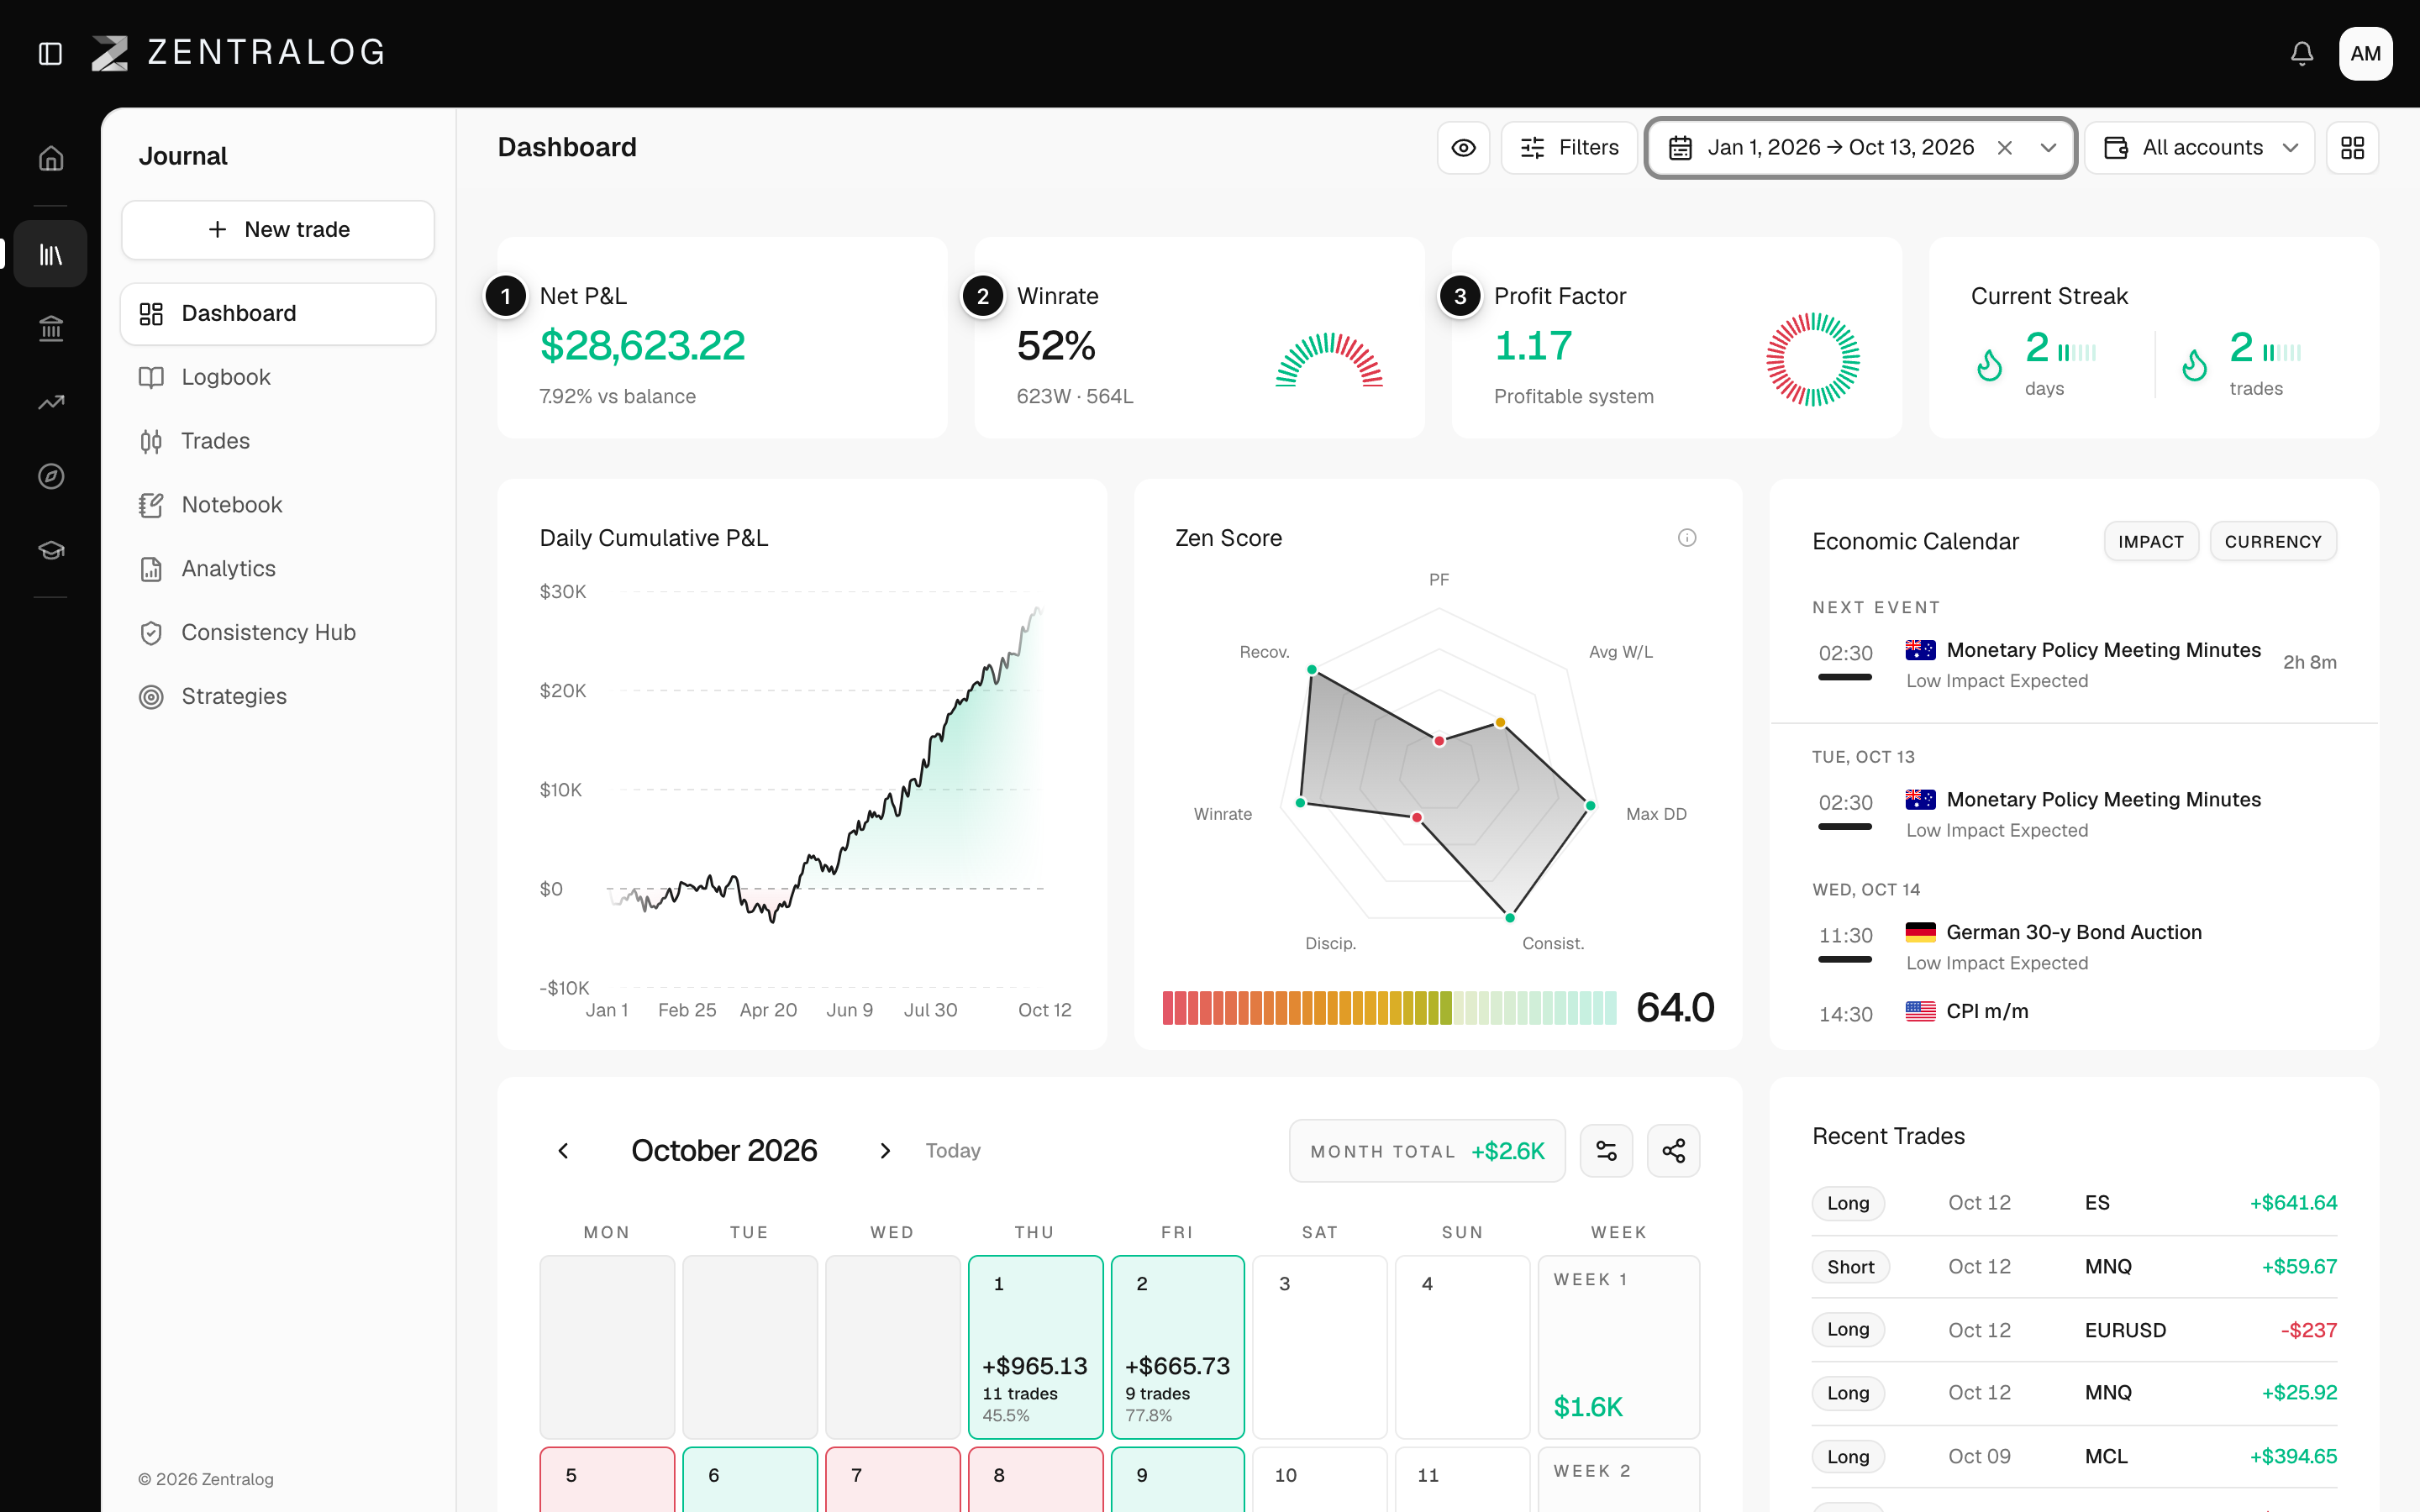
- Net P&L: your profit or loss after costs in the range. See net P&L.
- Winrate: share of winning trades; break-even trades don't count. See win rate.
- Profit Factor: gross profit divided by gross loss. See profit factor.
- Avg Win / Loss: your average winner next to your average loser. See average win and loss.
- Trade Expectancy: what you make or lose per trade on average. See expectancy.

The big Max Drawdown number comes from the same curve as the Drawdown widget, so both show the same fall in money.
FAQ
Why doesn't Winrate count break-even trades?
A break-even trade is neither a win nor a loss. You set where break-even starts in Outcome and break-even.
Can I see how a KPI is calculated from the card?
Dashboard KPI cards have no explain menu. Use the glossary, or the ⋮ menu on Analytics charts.
Related
Did this answer your question?