
Lab: Real or luck?
A Lab sheet that tests with statistics whether your edge is real or could just be luck.
Where: Journal → Analytics → Lab → Real or luck?
Your edge is the advantage that makes your trading win over time. This sheet uses only your closed trades.
Read the verdict
- Click the Lab tab, then Real or luck?.
- Read the verdict: Proven edge · 95%, Hints of an edge, Not yet distinguishable from luck, Negative edge or No proven edge.
- Read Your expectancy: what you make on an average trade. See expectancy.
- Read A result like this without an edge: «1 in 500» means a trader with no edge would get your result once in 500 tries.
- Read Trades to confirm it (80 %): you have them, or how many more you need.
Check the numbers and charts
- Read the six tiles under the verdict.
- Scroll to the six charts.
- Open a chart's ⋮ menu and pick Explain metric to see how to read it.
What's on the screen
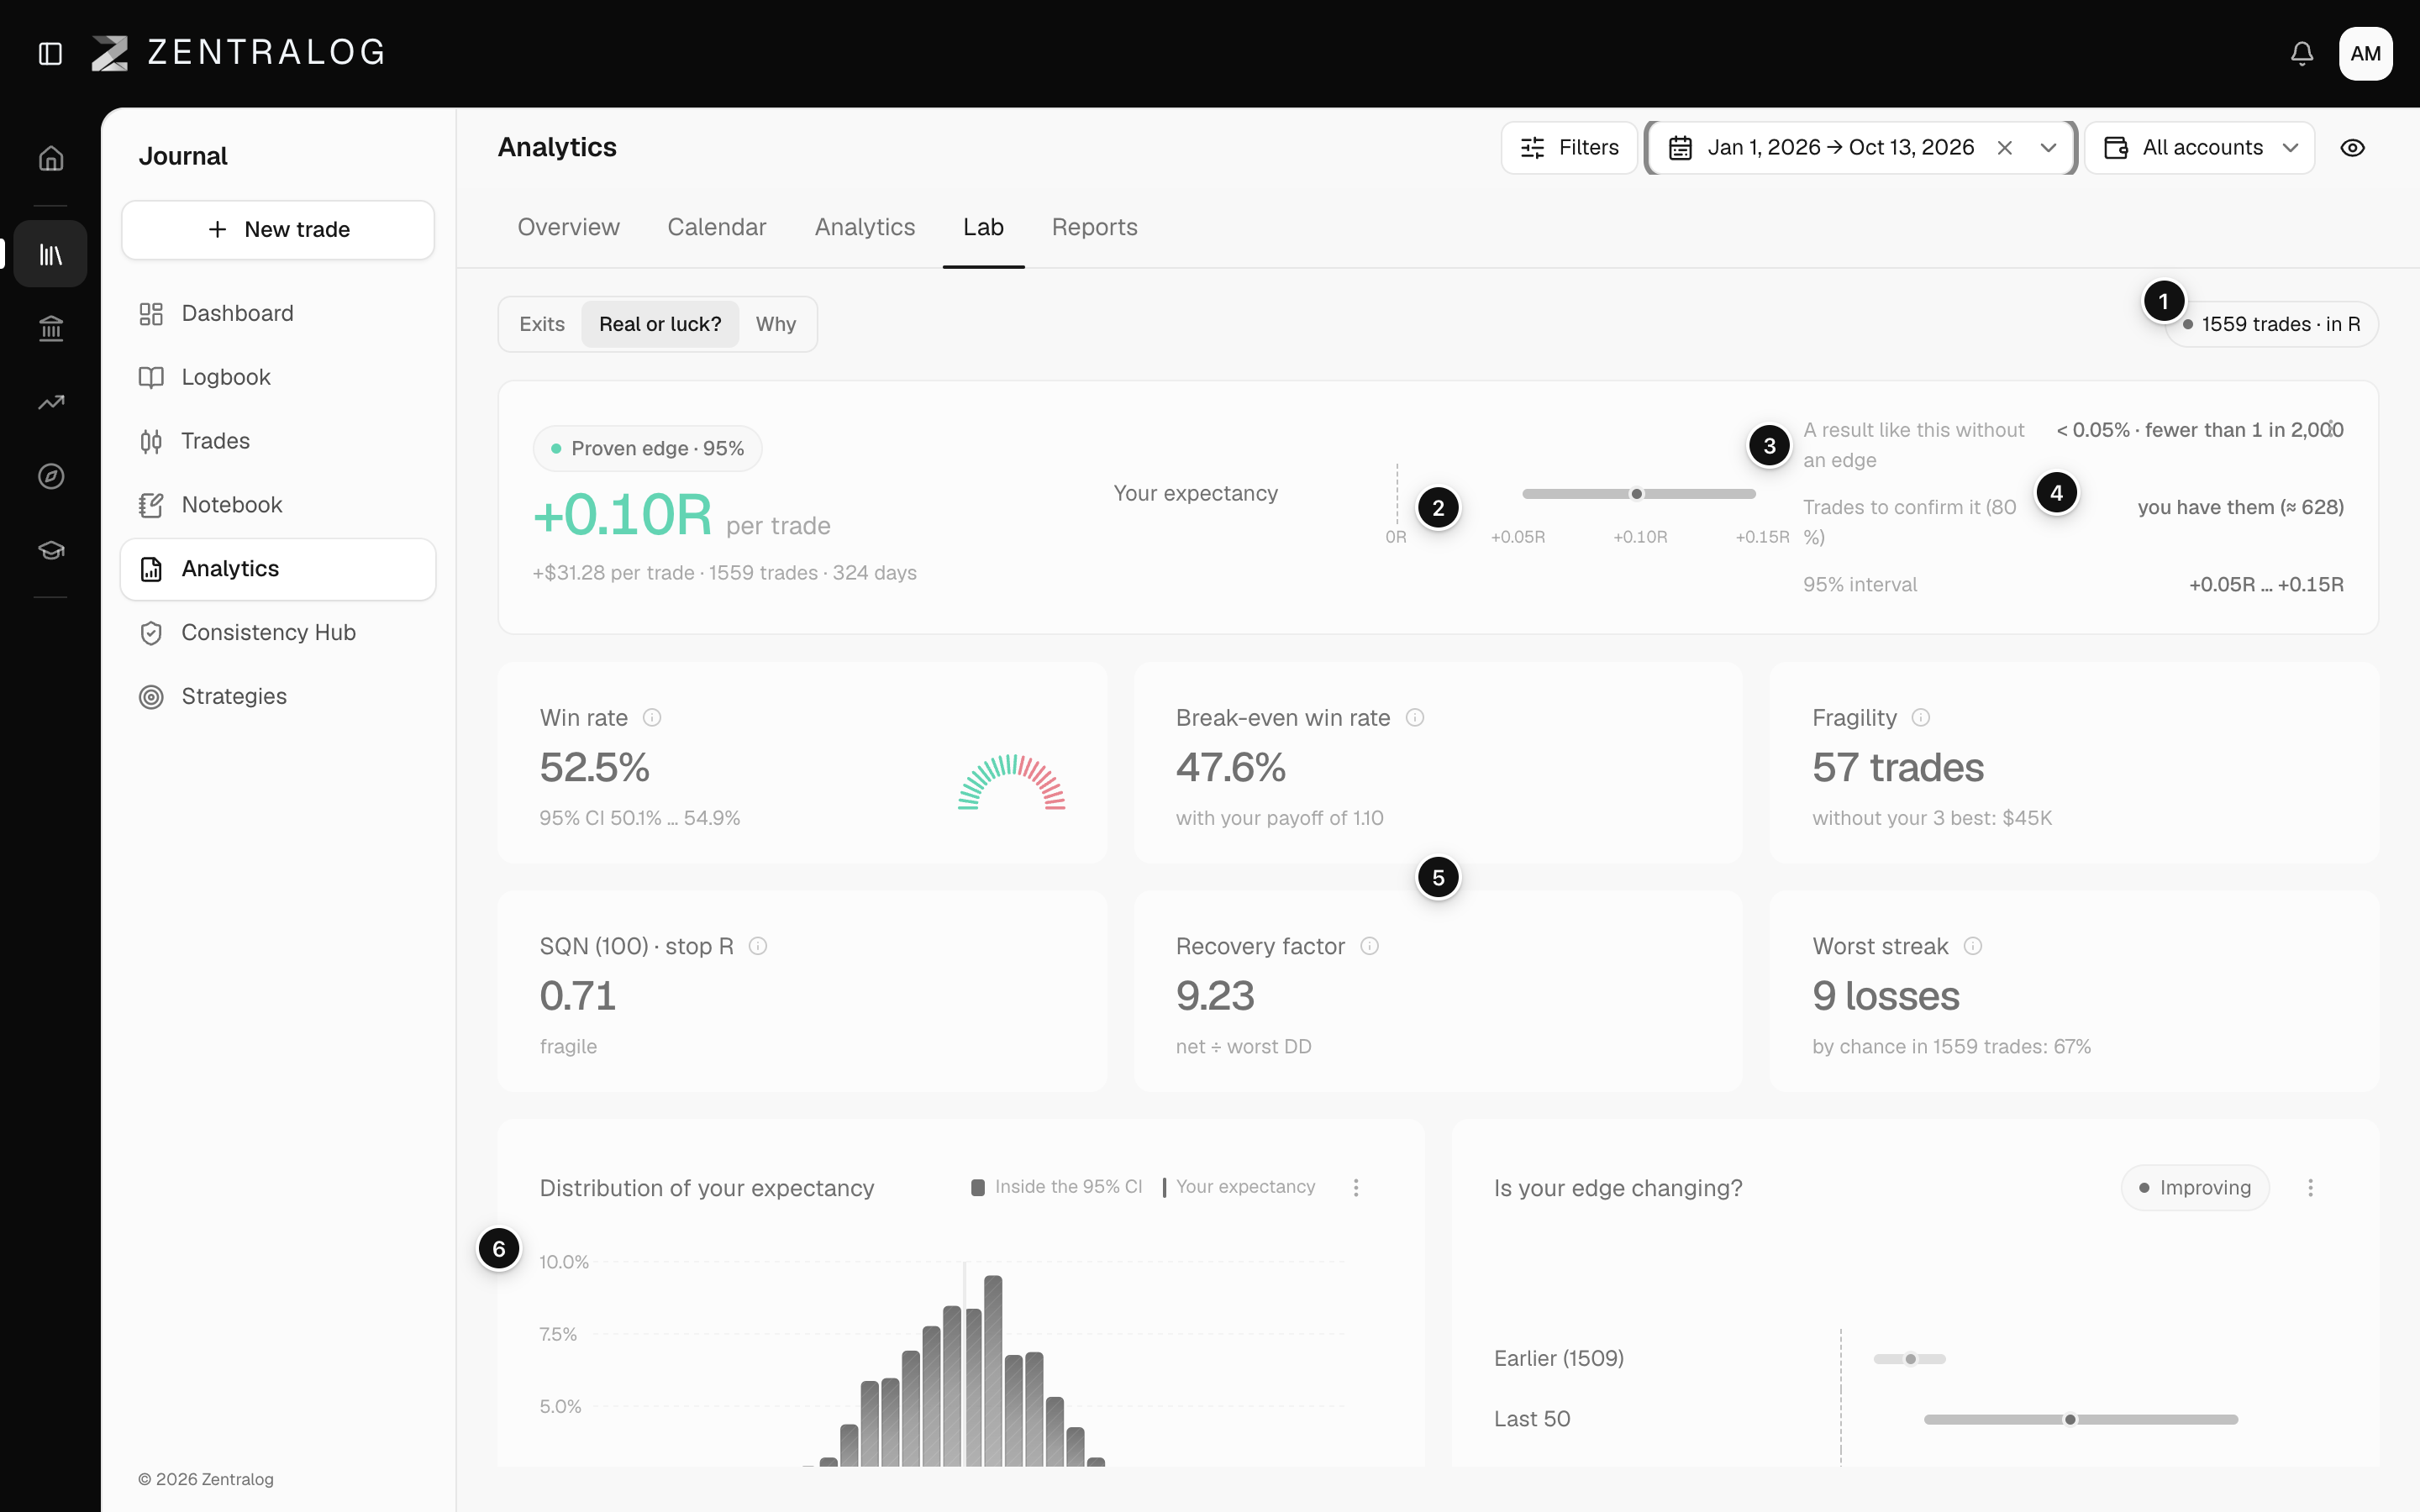
- Coverage pill: trades used, the unit (R or $) and the share with a stop.
- Verdict: whether your edge is proven, likely, unclear or negative.
- 1 in N: how often your result would appear by pure chance.
- Trades to confirm it: how many trades the test needs to be sure.
- Tiles: Win rate with its 95% range, Break-even win rate, Fragility, SQN (100), Recovery factor and Worst streak. See break-even win rate, fragility, SQN and recovery factor.
- Charts: Distribution of your expectancy, Is your edge changing?, Losing streaks in your next 100 trades, Expected maximum drawdown, Reliance on your best trades and Do your losses cluster?
The sheet works in R when at least 70% of your trades have a stop, and in dollars otherwise. Add stops to your trades for a fairer test. See Risk levels and R.
FAQ
How is «1 in N» calculated?
Zentralog reshuffles your trading days thousands of times as if your average trade were zero, and counts how often a result as good as yours appears. Under 1 in 20 is a Proven edge; under 1 in 5, Hints of an edge.
What does the «Is your edge changing?» chart compare?
Your last 50 trades against the earlier ones. It says Improving, Worsening or Stable.
Why does it say «The scope needs winners and losers to test your edge»?
Your filter has only winners or only losers. Widen the dates or pick more accounts.
Related
Did this answer your question?